
7 Reporting Tasks You Can Automate With Python Before Monday Morning
Pull data from five messy sources without touching a single spreadsheet tab If you want to automate reporting tasks before the week starts, this is where the real time sa…
Home/Reporting and Visualization
4 articles
Pull data from five messy sources without touching a single spreadsheet tab If you want to automate reporting tasks before the week starts, this is where the real time sa…
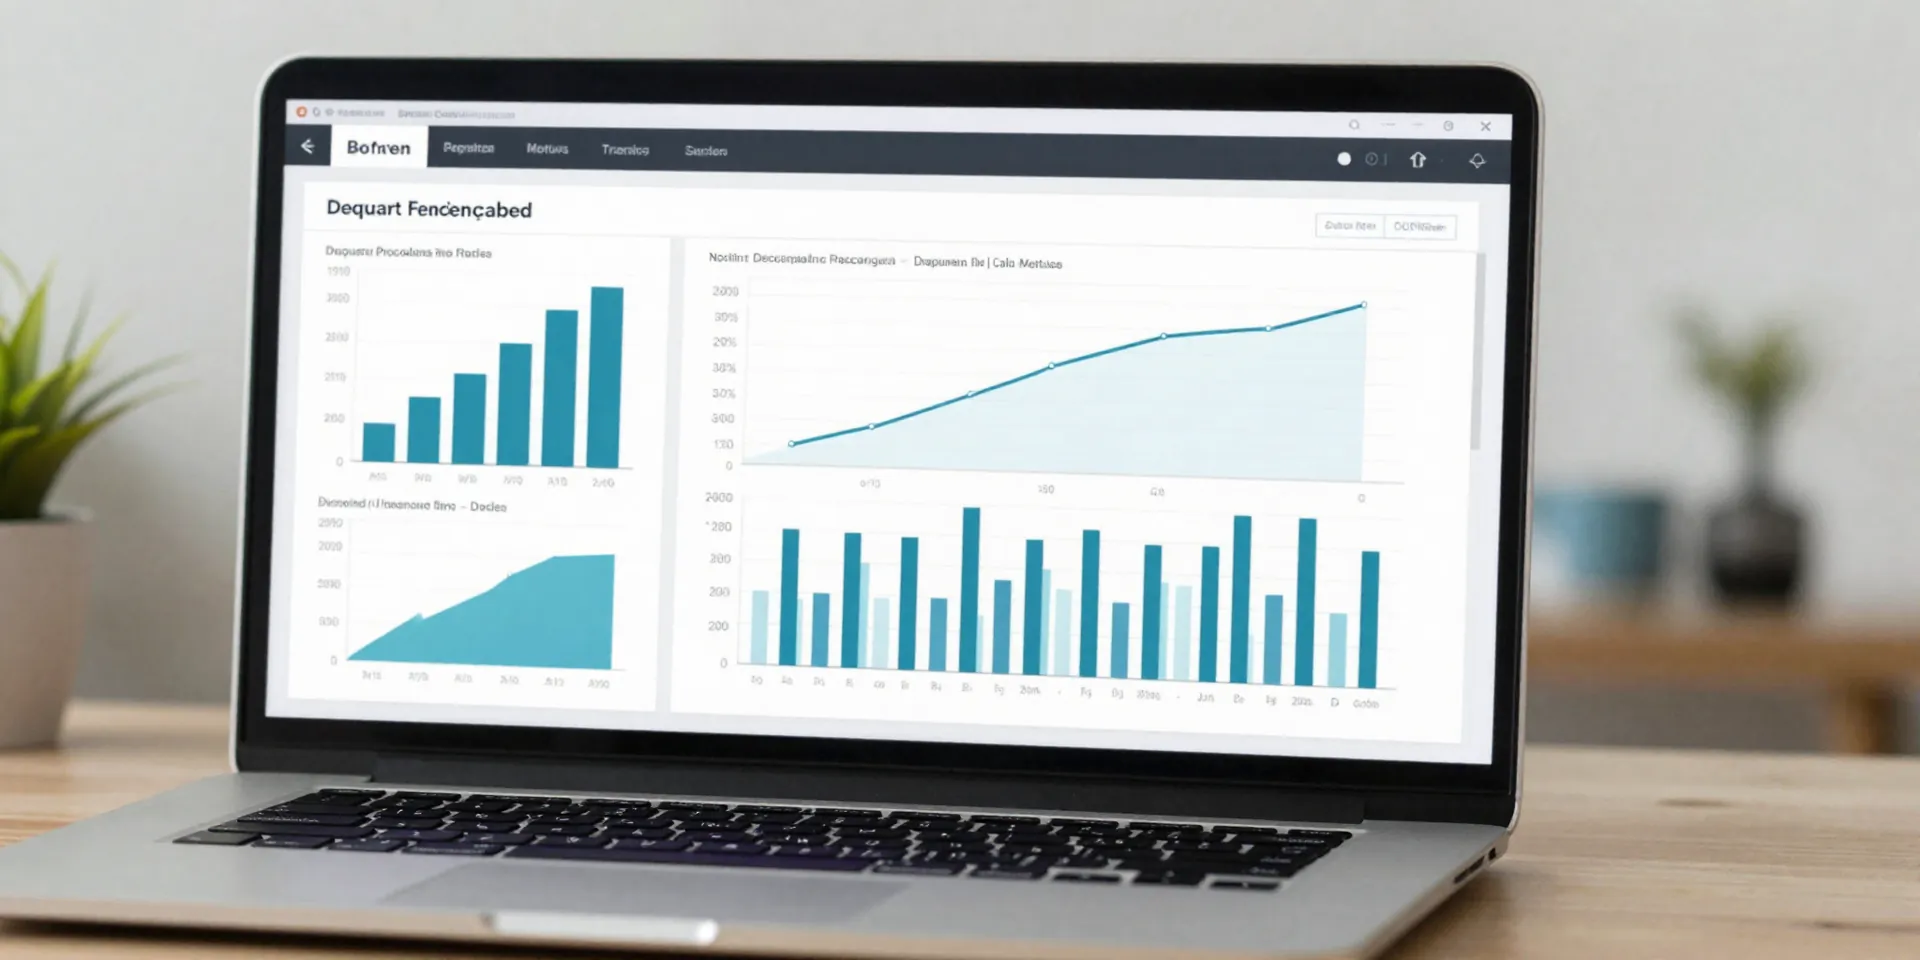
Use Bar Charts and Grouped Bars When the Question Is “Compared to What?” If you work with business data visualization, the humble bar chart is still doing a shocking amou…

Pick an export path that matches how people will actually read the report If you need to export charts Python can generate beautiful visuals fast, but the real decision i…

Stop Making Every Chart a Line Chart One of the most common data visualization mistakes beginners make in Python is picking a chart because it is easy to code, not becaus…